
Despite the public and private sector’s efforts to improve telecom infrastructure, 19 million Americans still lack fixed broadband connectivity, including a quarter of the rural population. While this is an improvement from just a few years ago, there remains an ever-present digital divide infringing on many Americans’ ability to merely connect with the digital world around them. Many entities, including the UN Human Rights Council, call broadband internet access a fundamental human right. In today’s post-pandemic digital world, broadband internet access is a necessity, not a luxury.
The Federal Communications Commission (FCC) defines broadband, or high-speed internet, as 25 Megabits per second (Mbps) download and 3 Mbps upload. A 1 Mbps download speed is needed for emails or general browsing, and a 25 Mbps download speed is required for video streaming. However, it’s clear that this level of service and technology is not accessible to everyone and is continuing to perpetuate issues of inequality in our country.
A large sum of America’s rural and urban population live in what is referred to as a “digital desert,” which is defined as an area without a single internet service provider (ISP). In many other regions, connectivity speeds are often much slower than advertised, too expensive, and/or unreliable. Therefore, the public sector must mandate telcos provide the minimum threshold for broadband access across the country and enforce healthy competition between two or more ISPs to ensure that connectivity is indeed high-speed and reliable.
Going granular
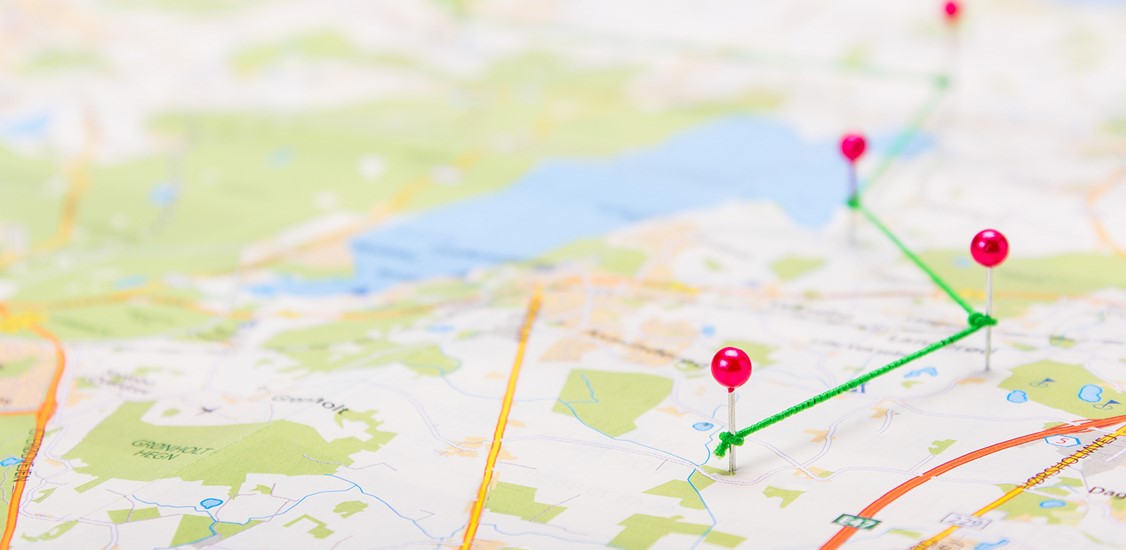
The most effective way to distribute broadband resources effectively is to leverage the extensive value of geospatial data. There must be a way to determine which areas of the country lack broadband access and identify where there is only one ISP leading to less-than-minimum threshold broadband speeds. However, accomplishing this requires technology equipped to handle massive datasets—tools that can sort, query, and visualize big data to inform decisions and plans quickly enough for telcos to address this issue effectively.
Geospatial data is emerging as a critical and proven method of identifying areas of digital incompetency. For almost two centuries, geospatial data has allowed humans to make sense of their world and solve the most daunting problems. In the 1830s, geographers applied spatial data to produce maps that helped them study cholera epidemiology. Today, geospatial data helps solve major societal, economic, and business problems, like predicting customer demand, minimizing the impact of natural disasters, and planning public health initiatives. Telcos can use geospatial data to optimize infrastructure investments, such as broadband mapping.


Broadband mapping is the consistent and verifiable mapping of existing broadband infrastructure, performance, and value to address critical gaps in broadband service data. It works by studying billions of data points in minutes to visualize the regions that need broadband the most. Accelerated analytics are used to carry out broadband mapping to close the digital divide efficiently and strategically.
Telcos can leverage geospatial tools to illustrate the breakdown of decision makers' criteria and effectively map fixed broadband offerings. Granular maps can show the landscape and environment to compare broadband access and terrain characteristics. Similarly, an analyst can map household income and ethnicity data along with high-speed access to demonstrate discrepancies and advocate for policy change.
Applying big location data
As mentioned above, there is an endless amount of data and sources at our fingertips today. Still, that data is often too large to navigate for the typical data scientist. Advanced analytics software helps take any amount of data from multiple sources—be it the FCC, school districts, or agricultural data—and construct an immersive, real-time, interactive visual experience. Organizations can manipulate the data in many ways and use the findings to articulate what infrastructure is needed most and where. The correct data can pinpoint precisely where broadband infrastructure is needed and ensure those resources are implemented correctly to obtain the most value and impact. For example, if location data suggest the majority of students at one elementary school do not have broadband access in their homes, this would indicate that the school building should provide increased public internet services to its students and surrounding households.
Many telcos are already utilizing some form of geospatial analytics to plan the placement of 5G antennas based on where their customers are and where heavy data users preside. Telcos use this mobility data to see where people are moving during the day and where they use the most data in space and time. Visualization systems are essential for taking geospatial data and sharing it with key stakeholders to formulate practical solutions that will inflict more significant policy change to help close the digital divide in our country.
The reliability factor
Beyond the basic concept of access, it’s also imperative to address the reliability component of broadband. Take regions of California, for example. Almost every time there is a fire, cell networks fail. Increasingly, these failures are being viewed as an infringement on fundamental human rights. Networks must be robust and resilient in natural disasters and emergencies, especially as more of our lives depend heavily on an internet connection. This is critical to leverage geolocation data in emergencies, access health data, and personal and financial information, and connect to in-home smart devices to perform basic tasks.
Analysts can apply accelerated analytics and interactive visualization tools in these situations to maintain network reliability across mobile networks in near real-time proactively. Practically, this is accomplished by enabling the rapid identification of denigrations, anomalies, and outages that impact customer experience. By accessing, visualizing, and analyzing massive, complex data in real-time and at scale, providers can produce network reliability reports in seconds rather than minutes, allowing engineers to identify anomalies and trends quickly and get networks back up and running in minutes.
There is a massive movement on the social justice front regarding broadband internet access, which is why it has never been more critical for public and private entities to take tangible steps to provide equitable access to broadband technology. This has been a concern of the FCC in the past, but it’s essential to address it more directly.
Improved geospatial tools paired with advanced analytics and visualization software will allow companies to look at large areas quickly and determine the best route of action from that data. This is the best way to locate and emphasize areas needing high-speed internet access and ultimately help close the digital divide.